In the past twelve months, I’ve seen 15 of my close friends living in the Bay Area having kids. That’s a lot, with more than one new cute little name to learn (Felix, Moritz, Ilya, Oliver, Hendrix…)
 Since most of my friends are about my age or older — 35 on average — and often in a stable relationship for many years, I am left wondering why the sudden spike.I came up with two reasonable explanations and a ton of thoughts!My first explanation would be that there is some kind of a Trump bump. Given the anxiety of our ages, parents might as well have kids to escape the deluge of insanity that floods every day from the news. Keep cool and relax. But it doesn’t seem to hold very much, since the birthrate is the lowest in 30 years. However, the data does not include end of 2017 and 2018. Let’s see how we fare at the end of the year…The other explanation is simply that the my friends tend to have babies later (most of them are PhD), because of their socio-economical conditions. Living in a very expensive place, with unstable jobs in their early career makes it harder to have kids young, but somehow the clock is ticking and the age 35-40 period is the last window of opportunity from a biological standpoint. This seems to be confirmed by the facts, given that women in the Bay Area have the oldest age for first babies (32.9 y.o. for college educated women!)(Reader, beware: I am not en economist or a demographer; everything that follows are just wild theories that I cannot test)Now, more general assertions… One of the excerpt from Piketty’s “Capital in the Twenty-First Century” was his admission that economics fails to understand what drives fertility, while it should be regarded as one of the most important aspect in decision making.
“If life expectancy is taken as given, the fertility rate determines the demographic growth rate. The important point to bear in mind is that small variations in the number of children couples decide to have can have significant consequences for society.
What demographic history teaches us is that these childbearing decisions are largely unpredictable. They are influenced by cultural, economic, psychological, and personal factors related to the life goals that individuals choose for themselves. These decisions may also depend on the material conditions that different countries decide to provide, or not provide, for the purpose of making family life compatible with professional life: schools, day care, gender equality, and so on. These issues will undoubtedly play a growing part in twenty-first-century political debate and public policy. ” – Thomas Piketty
When you don’t understand how the pyramid age is built, you probably miss many things about trans-generational money transfer, immigration (coping with a shrinking workforce… and fueling xenophobia) and voting patterns.
 Notice the large bump at age 50-60, due to the Baby boom. This generation is about to retire, and leaves me wondering whether the improving employment rates that we witness in the US nowadays isn’t just the boomer generation going into retirement (one old person’s job is worth two new jobs in terms of salaries — hence no increase in wages.)On the topic of political renewal, it seems that there’s a big change in the horizon. Identity has been derided and criticized, but it seems that it failed because it wasn’t truly a politics of identities: looking at the demographics of the latest Netroots event (“Organizers boasted that two-thirds of the speakers were people of color, 63% were women and a quarter identified as LGBT”), that seems like a seismic shift about to happen. It’s always dangerous to do comparison between countries which are extremely different, but something similar happened in France in 2016, where the newly minted party “En Marche” (started by the French president Macron) completely changed the demographics of congress: the number of women in Assemblée Nationale went from 26% to a record 38% in a single election! (50% relative increase), and the average age went from 54 in 2012 to 48 in 2016 (five years younger!) It is remarkable that France, with its fertility rate consistently above 2 children per women, is one of the few countries in Europe that didn’t fall for far-right extremists. It is my hope that the US is capable of reverting back to what makes it strong, “E pluribus Unum.”Whereas Germany is widely regarded as the most economically efficient in Europe, it is tempting to think that this is the flip side of the demographic coin: a lesser number of children (unemployed individuals) makes it relatively cheaper for a welfare state economy (less education to pay, more economic throughput) compare to countries which achieve demographic renewal. But in the long run, aging population in Germany is a ticking bomb:
 I’m afraid that’s going to impact a lot of “old Europe” countries… But this is not entirely limited to Europe. China will face a cataclysmic situation fairly soon, as a result of its one-child policy, which ended only a few years ago. Now, the country is promoting childbearing in a forceful way, and I’m not sure this will (Singapore has similar goals, but smoother techniques.) It’s not quite clear how one can escape the fateful situation, when the number of male-to-female ratio is 1.15 (there are 30M more men than women, hence 60M involuntary celibates), most of current Chinese adults grew up in a single-child family, and China is essentially closed to immigration.Anyway. I was pretty amazed during my recent trip to Taiwan to see many young mothers with kids strolling around. But that shouldn’t be surprising — I just realized how much we in the Bay Area are living in a bubble!edit May 2019: There’s a debate on life expectancy, and how the number in the past are skewed by high child mortality. This article gives a clear view: Facing up to the global challenges of ageing
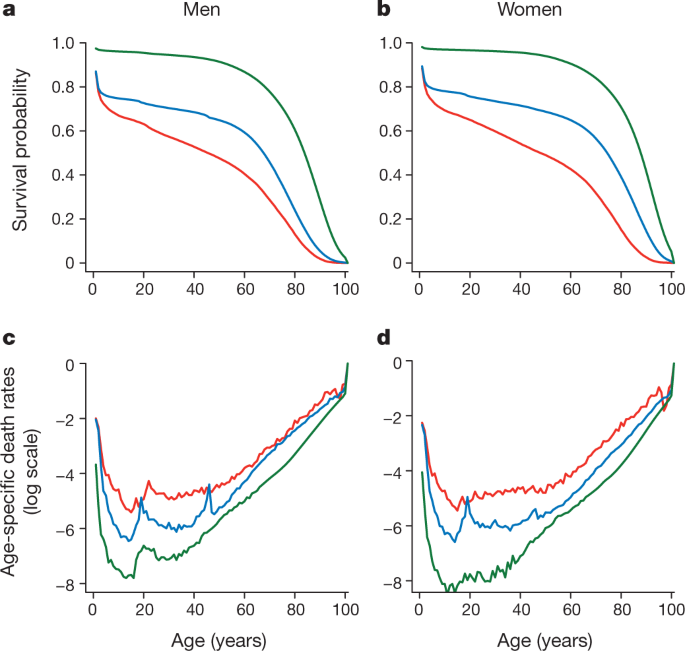
a–d, Cumulative survival (a, b) and mortality rates (c, d) in men (a, c) and women (b, d) based on 100,000 individuals per birth cohort (1850 (red), 1900 (blue) and 1950 (green)) from life tables from the Netherlands. c, d, Note that the y axis is a log scale.
edit June 11th, 2019: I found this amazing website — check it out: World Population Growth – Our world in data